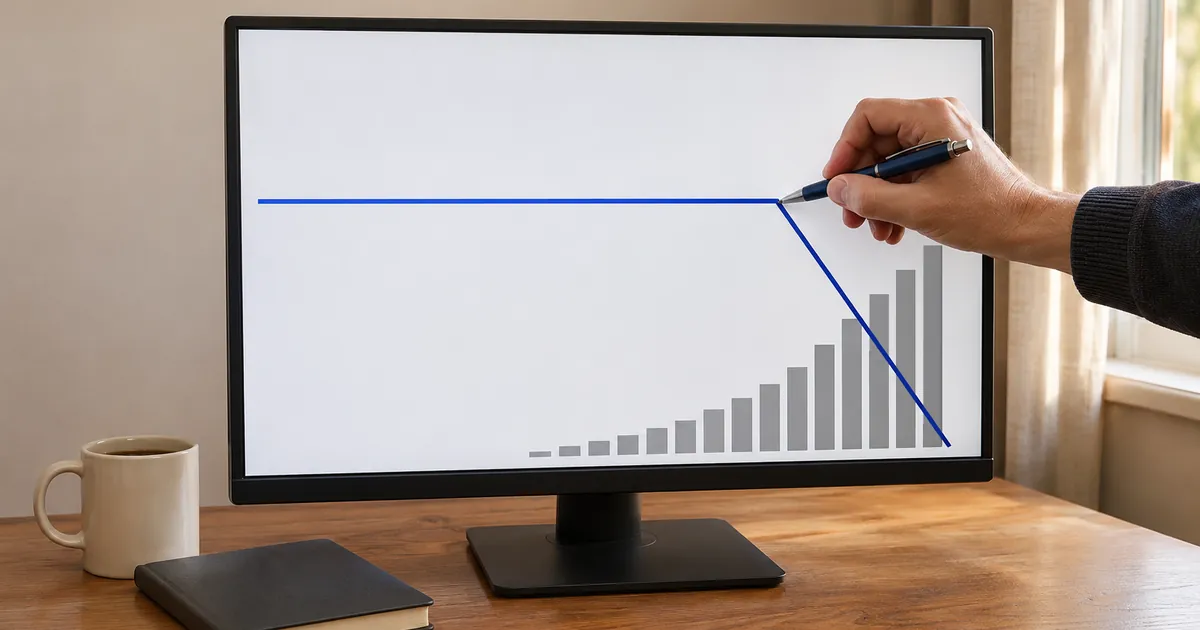
Before you change anything, find out which number fell. Compare Search Console clicks with GA4 sessions, check the date against Google's list of updates, test your analytics tag and look for bot traffic that stopped. Plenty of drops turn out to be a reporting change with no customers lost. Pay for an audit when clicks fell on pages that bring enquiries and none of those checks explains it.
Our own Search Console showed a crash in late October that turned out to be nothing, sitting next to a smaller drop that was real. Both are below, with the numbers. If your worry is that AI assistants never mention you, that's a different problem, covered in how to rank in ChatGPT.
Which number actually dropped?
Start with Search Console, because it counts what happened on Google: impressions, clicks and average position. GA4 counts sessions on your site from every source, and only when its tag fires. If Search Console clicks held steady while GA4 organic sessions fell, suspect your tracking before your rankings. If both fell together, the drop is probably real.
Google's own guide to debugging Search traffic drops starts the same way, with the shape of the Performance report chart. Its list of causes runs from algorithmic updates and technical errors to hacked or spammy pages, seasonality and site moves. It adds one useful split: when impressions hold but clicks fall, look at your titles and snippets, or at a richer result that is taking the click.
Set the report to the last 16 months before you read anything into it, then compare the drop period with the one before it, query by query and page by page.
Can the chart crash when nothing broke?
Yes. Search Console's average position is an average over every impression, so when Google starts showing one of your pages for new searches far down the results, the line falls even if no existing ranking moved. Read position by query and by page before you treat a falling line as lost rankings.
Search Console's help page on impressions, position and clicks says the metric "averages the position value for all impressions". Add a few hundred impressions at position 65 to a site that usually sits around 5, and the average collapses while the page-one results stay where they were.
What did our own drop look like?
On 30 October our site's average position in Search Console was 9.4. The next day it was 37.0, and on 1 November 57.1, while daily impressions rose from 15 to 37. Nothing had broken. Google had started showing our penetration testing cost guide for broad pricing searches, mostly between positions 45 and 95.
Here are the two 28-day windows from our weekly report (Search Console, overlord.team, pulled 16 November 2026):
Window | Clicks | Impressions | Average position |
|---|---|---|---|
19 Sep to 16 Oct 2026 | 21 | 622 | 4.9 |
17 Oct to 13 Nov 2026 | 5 | 851 | 39.8 |
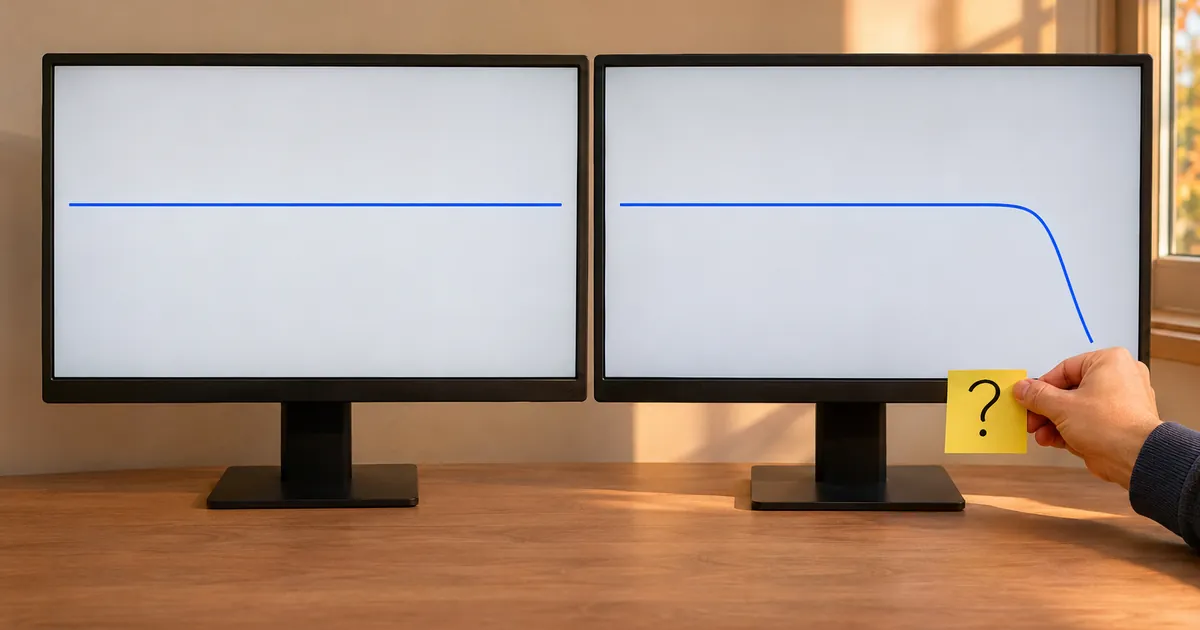
The position column is the false alarm. The cost guide went from zero impressions to 432 at an average position of 65, while the homepage and pricing page both held an average position of 4.8.
The clicks column is real, and three pages account for most of it. A news post about an AI agent that retrained itself had 226 impressions and 5 clicks in the first window and 9 impressions in the second, after the story went cold; we had already redirected it to a related guide on 5 November. Our growth marketing service page went from 4 clicks to none, and we have logged a metadata fix for it. GA4 agreed with the direction: organic sessions fell from 60 to 27.
The third is our homepage, down from 8 clicks to 2. We haven't found one cause for that yet, and we're not going to invent one. The cost guide had not been edited when the position line broke on 31 October. A refresh eight days later did not lift those deep positions. A page sitting at position 65 needs supporting pages and links more than another rewrite.
Did a Google update cause the drop?
Check the date first. Google lists confirmed ranking updates on its Search Status Dashboard, with a start time and, once finished, a duration. If your drop began before an update started, the update didn't cause it. If it began during one, wait: Google recommends waiting at least a full week after a core update completes before you analyse the change.
Our position line broke on 31 October. The November 2026 core update began on 10 November at 10:06 Pacific time, and Google said the rollout may take up to 2 weeks. So the update can't explain our chart, and on 16 November it was still rolling out for everyone else.
When the dashboard shows it complete, compare a week after with a week before the start, and judge the size. Google's core updates guide calls a slip from position 2 to 4 small, with no drastic action needed, and a fall from 4 to 29 large, worth a deeper look at the whole site.
Is your tracking broken?
If GA4 fell and Search Console didn't, probably. Common causes are a tag missing from some templates after a redesign, a consent banner change that stops the tag firing, a new filter, or a move to a new domain. Open GA4's Realtime report, visit the page yourself from a phone and check that your visit shows up.
Google's Realtime report help describes it as monitoring activity "as it happens", which makes it the quickest test after a release.
Tracking can also inflate the numbers you're comparing against. In the same window, our own GA4 recorded form submissions from one user landing on our admin pages: our own team, counted as key events. GA4 can filter out internal traffic by IP address, but its help page warns that with an exclude filter "the excluded data is never processed", so try the filter in testing mode before you switch it on.
Was the traffic you lost ever human?
Not always. GA4 removes known bots automatically, but only the ones on its list, and it won't show you how many it removed. Bots outside that list can still be counted as visitors, so when one stops crawling your site, sessions fall and no customer went anywhere. Very low engagement on the lost sessions is the clue.
Google's known bot-traffic exclusion page says the list comes from Google research and the International Spiders and Bots List, and that you "cannot disable known bot traffic exclusion or see how much known bot traffic was excluded".
Compare the lost sessions' engagement rate, country and source with your normal traffic. If they were near-zero engagement from one source, you lost noise. Blocking the bots that still arrive, without blocking Google, is a separate job, covered in our guide to stopping bot traffic.
Could it be a technical or security problem?
Look here when the drop is sharp and site-wide. Google's debugging guide points to the Crawl stats and Page indexing reports for server errors, robots.txt problems and stray noindex tags, the Security Issues report for malware warnings and the Manual Actions report for spam penalties. A noindex mistake drops traffic slowly, page by page, as Google recrawls.
Site moves are the other usual suspect. If you changed URLs, Google's guide says a medium-sized site can take a few weeks for Google to notice the change, and rankings can wobble while it does.
For seasonal businesses, check your biggest queries in Google Trends before anything else. If interest fell everywhere, your site didn't do anything wrong.
Should you wait, fix it yourself or pay for an audit?
Wait if the drop sits inside a running update or only the average position moved. Fix it yourself if one check found a clear cause, such as a missing tag, a stray noindex or a dead page. In our view, pay for an audit when clicks fell on pages that bring enquiries, every check came back clean and the drop has held for a month.
What you see | Likely cause | What to do |
|---|---|---|
Average position fell, impressions rose, clicks steady | New searches at low positions | Nothing yet; read position by query and page |
GA4 sessions fell, Search Console clicks steady | Tracking | Test the tag in Realtime; check recent releases and consent changes |
Clicks and impressions fell from a date inside a confirmed update | The update | Wait a week after it completes, then compare |
Sharp, site-wide fall | Technical or security issue | Page indexing, Crawl stats, Security Issues, Manual Actions |
Lost sessions had almost no engagement | Bot traffic stopped | Nothing to fix on rankings |
Clicks fell on pages that bring enquiries, all checks clean | Rankings or demand | An audit, or a closer look query by query |
Our technical SEO audit is $500 for one site and ends with a written report and a prioritised fix list. Run the free checks first. If one of them finds the cause, you don't need us.
FAQ
How long should I wait after a Google core update?
Google recommends waiting at least a full week after a core update finishes before analysing Search Console, then comparing that week with a week before the update began. Google's Search Status Dashboard shows when an update is complete. On the dashboard, the last three core updates took between 11 and 18 days to roll out, so the whole wait can run to three or four weeks.
Why are my impressions up but my clicks down?
Usually one of two things. Your pages started appearing for more searches at low positions, which adds impressions nobody scrolls to, or your position held while fewer people clicked. Google's debugging guide points at titles and snippets for the second case, or a richer result taking the click.
Does GA4 show bot traffic?
Not the bots it recognises. GA4 excludes known bots and spiders automatically, using Google's research and the IAB's International Spiders and Bots List, and you can't switch that off or see how much was removed. Bots outside that list can still show up as sessions, usually with very low engagement and odd sources.
Can a website redesign cause a traffic drop?
Yes, in two ways. Changed URLs without redirects make Google recrawl and re-rank the pages, which can take a few weeks for a medium-sized site. And a new template can ship without the analytics tag, so GA4 shows a drop while Search Console doesn't. Check both before blaming the design.
What to do next
Pull the two date windows in Search Console, line them up with the update dates and work down the table. If you'd like someone to go through the numbers with you, book a free 30-minute assessment.
How this guide was made: Ramin Moradi researched and wrote it with AI assistance. Every Google help page was checked against the linked page on 16 November 2026 (Europe/Istanbul). Our numbers come from overlord.team's own Search Console and GA4 for 19 September to 13 November 2026, pulled that morning; Search Console dates are Pacific time. The audit price is as published on our SEO service page that day.
Comments